Earthwatch Europe
The Great UK WaterBlitz campaign report
The brief
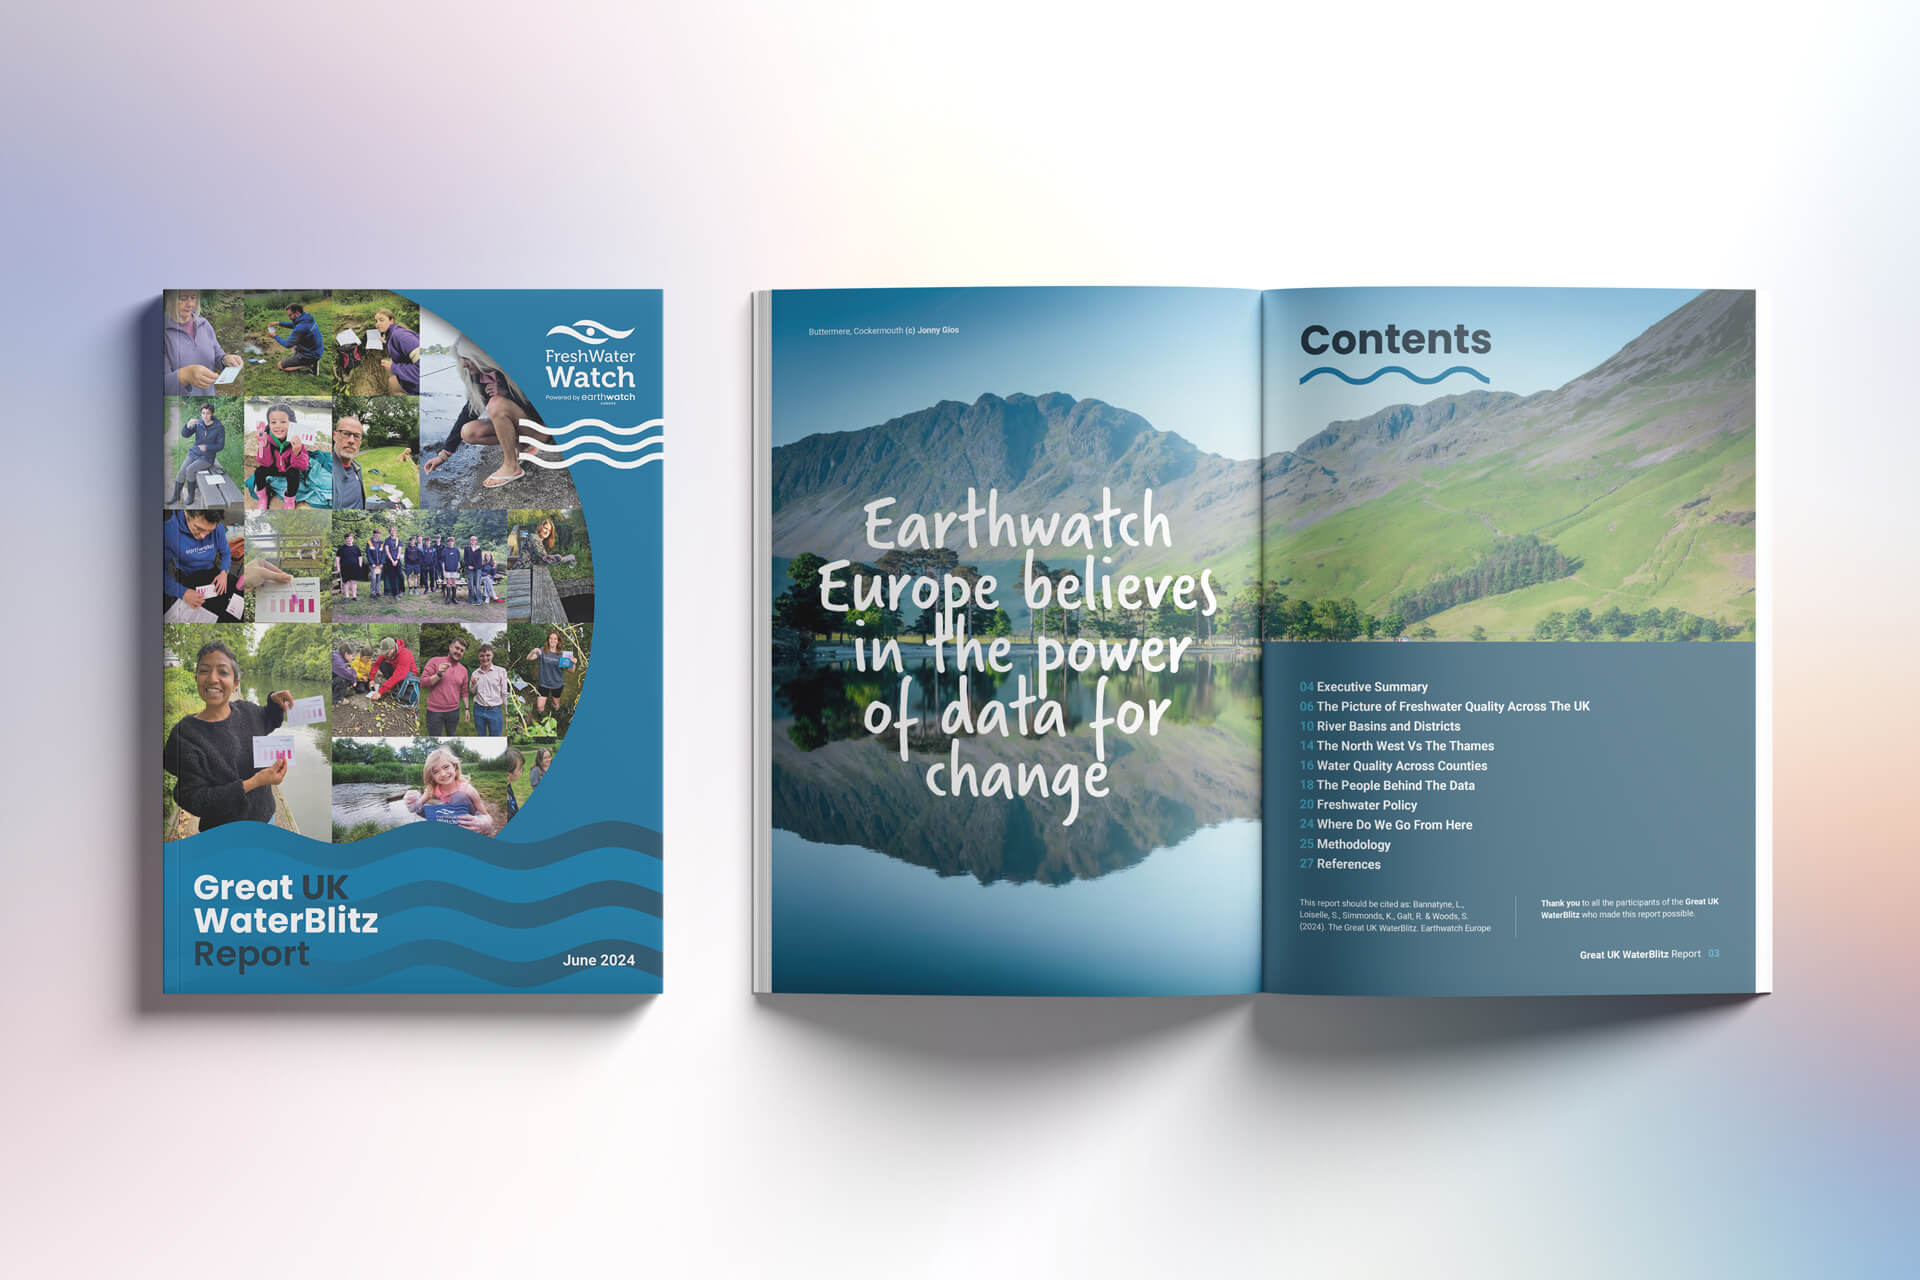
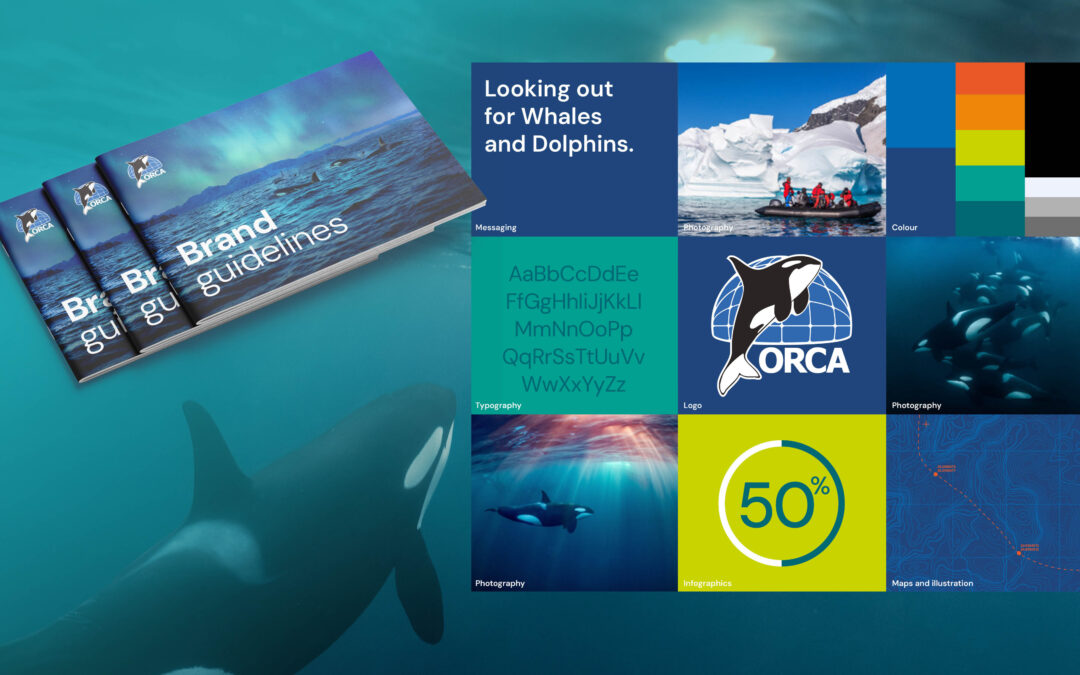
Earthwatch Europe connects people with scientists to conduct environmental research and supports citizen science initiatives that address pressing environmental challenges. They led the Great UK WaterBlitz, the UK’s largest citizen science water quality monitoring initiative, engaging volunteers to collect and report water quality data nationwide.
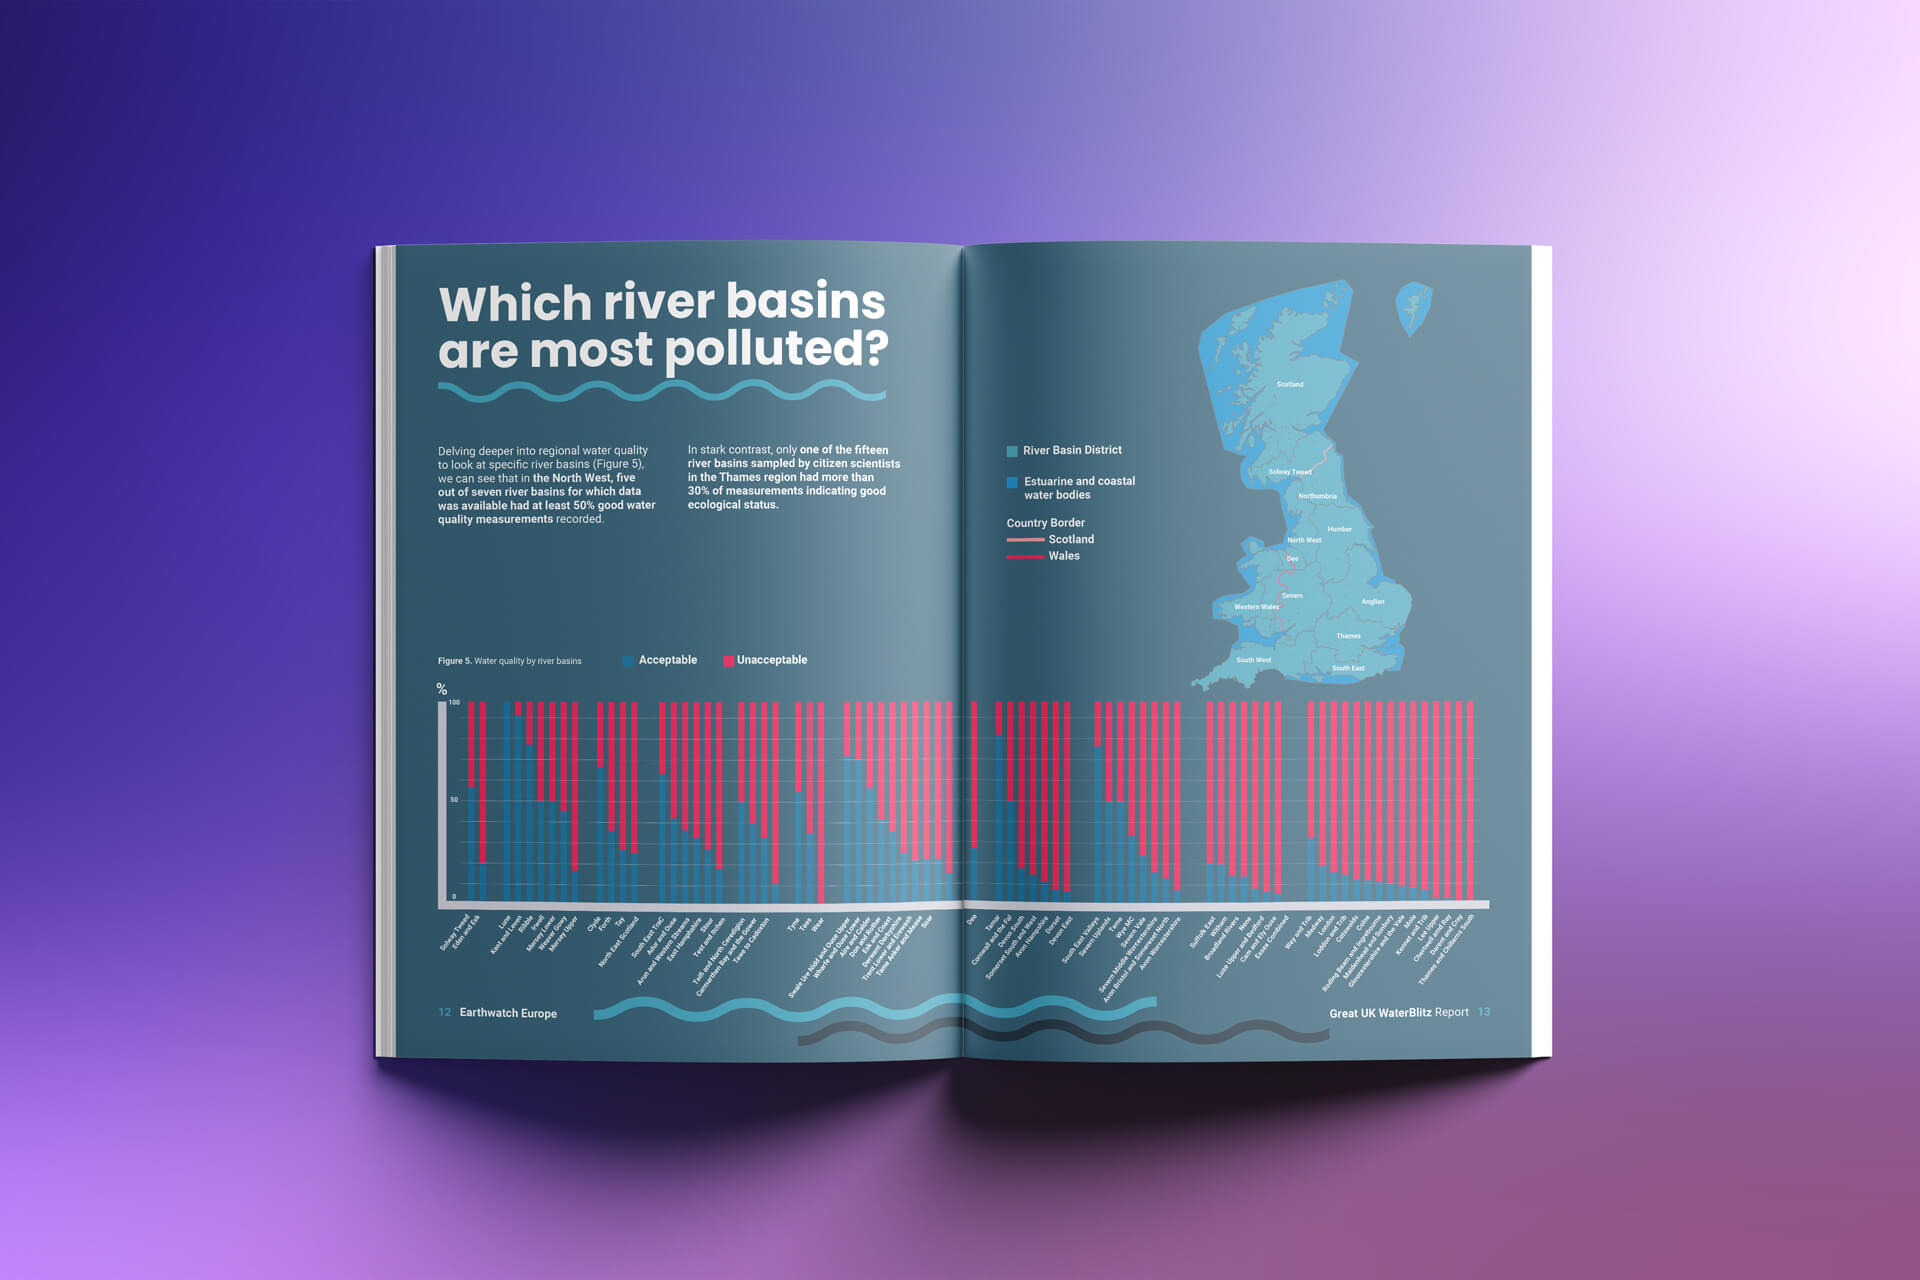
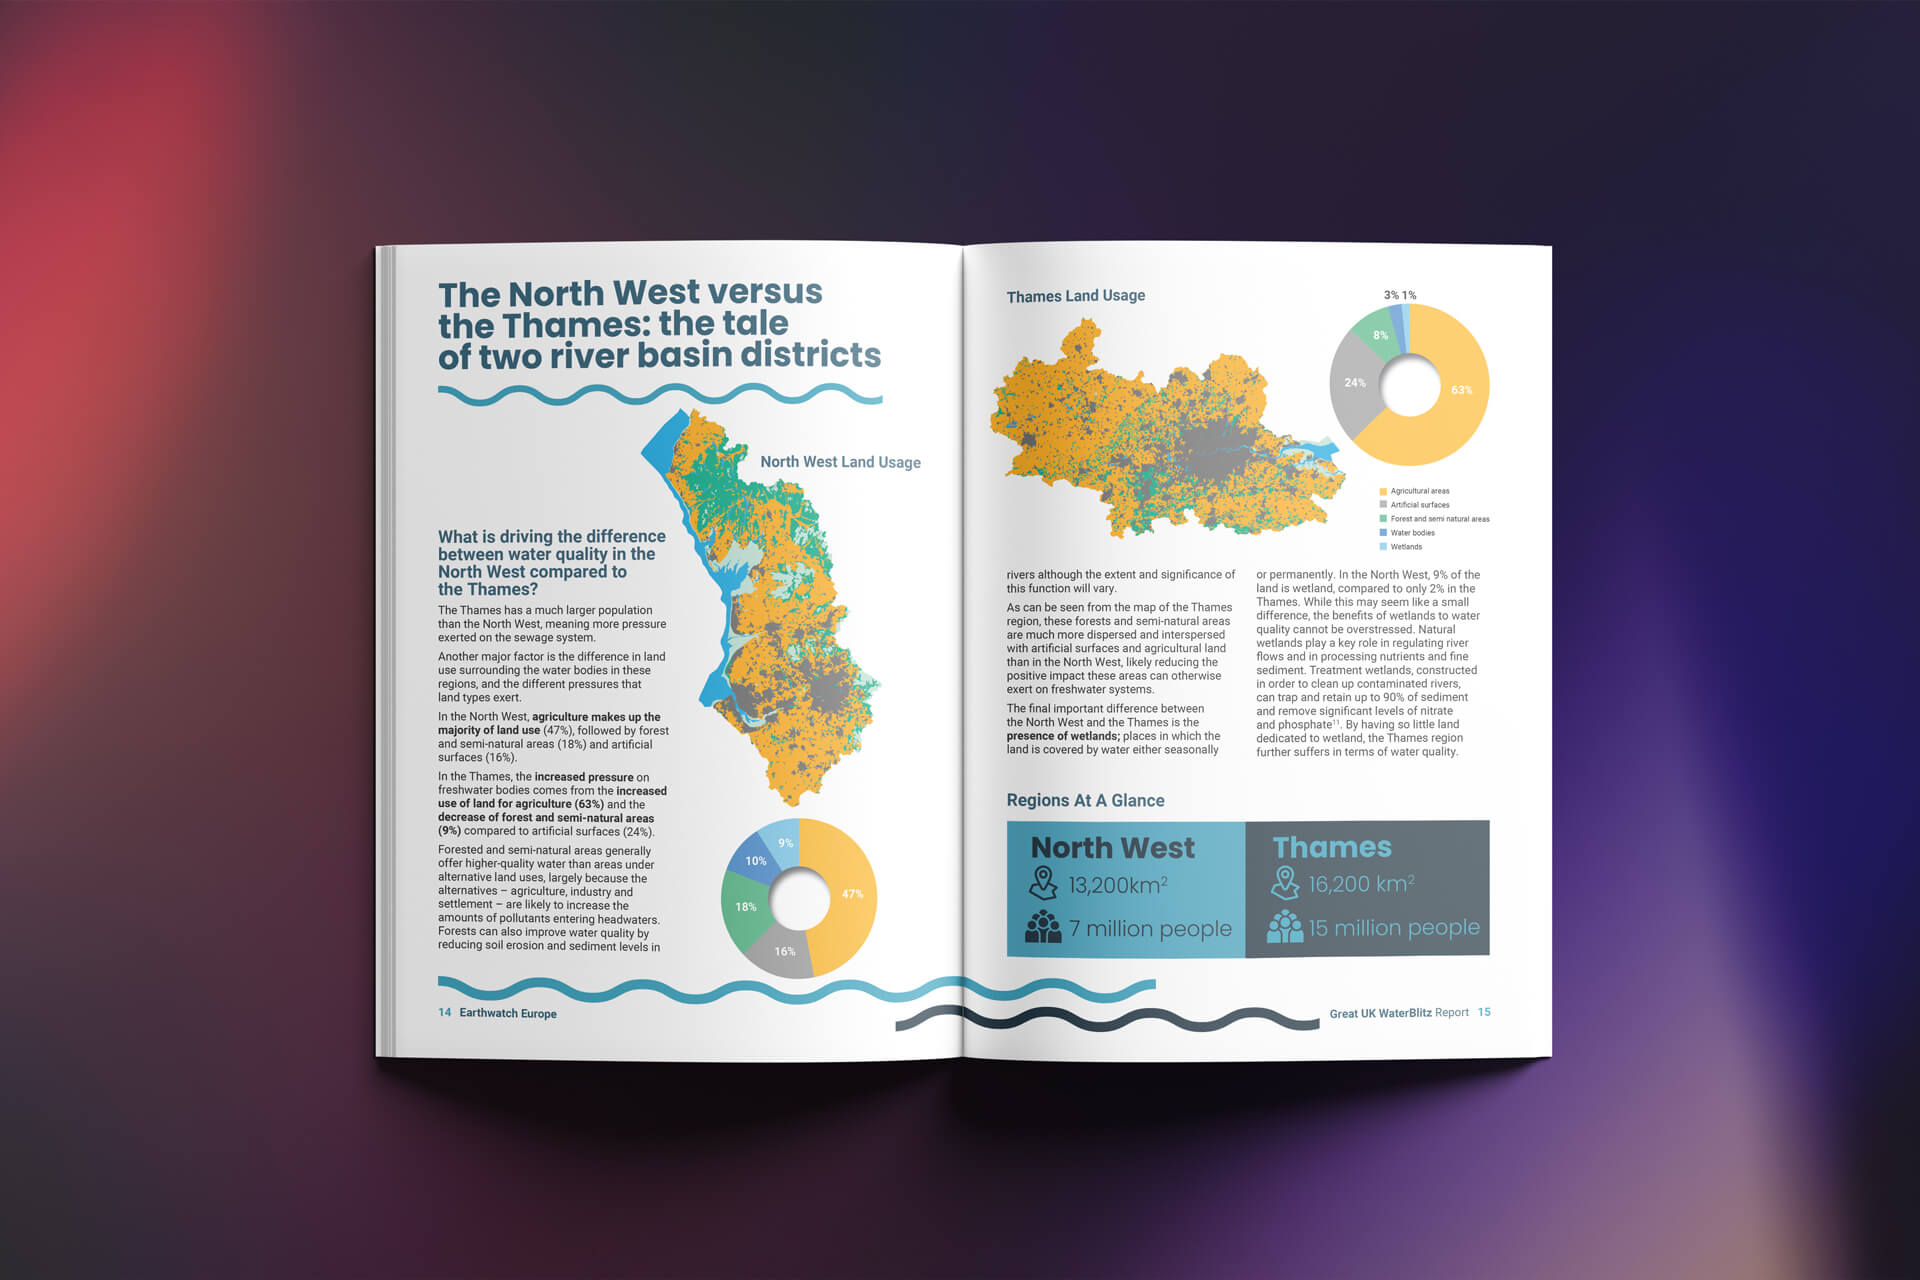
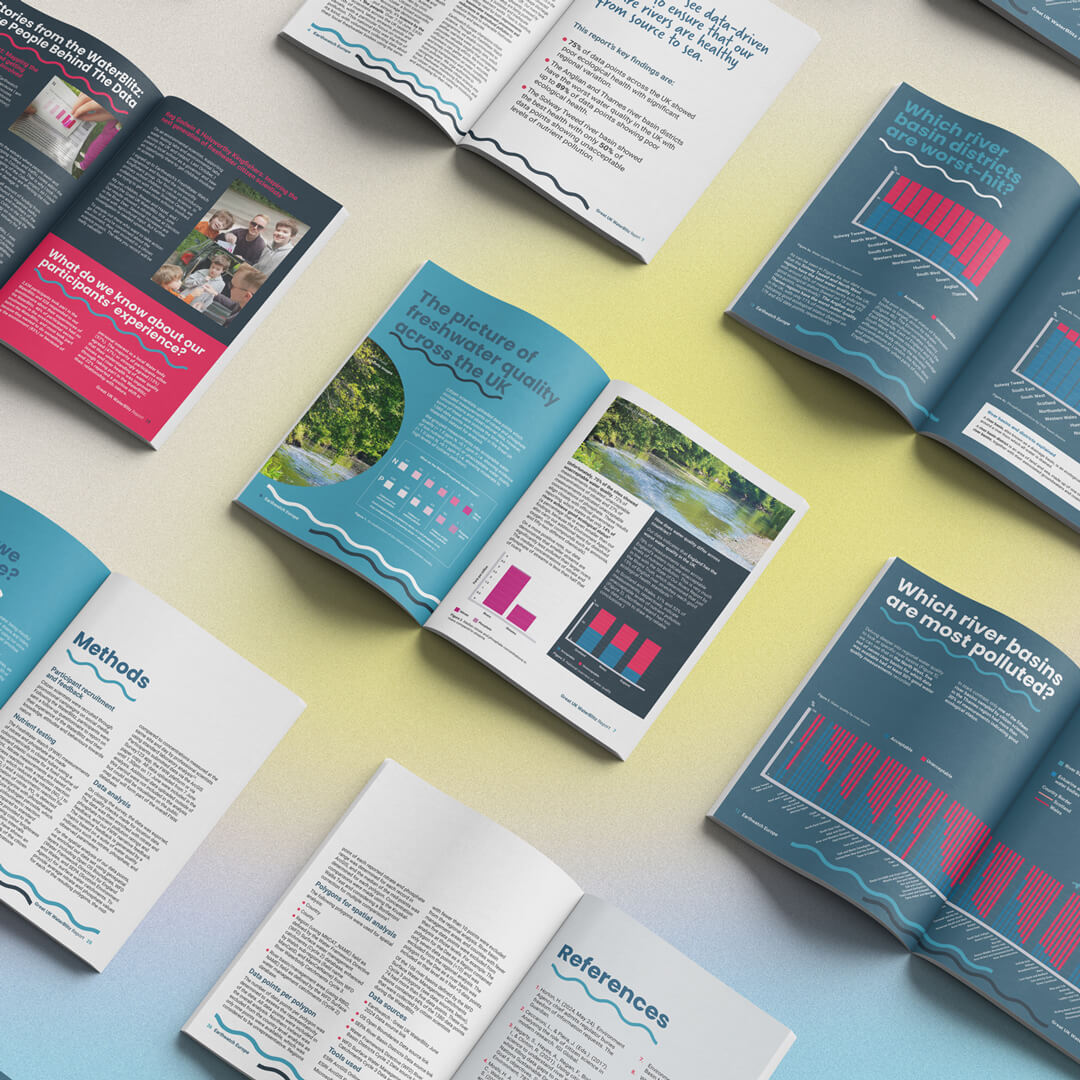
The Graphic Design House has worked with Earthwatch Europe for over a year, designing impact reports and pitch documents. For the Great UK WaterBlitz campaign, we were tasked with creating a 28-page report that clearly communicated the campaign’s findings and impact to a wide audience. The report needed to present complex scientific data in a way that was accessible, visually clear, and suitable for sharing with media, stakeholders, and the public.
The report featured on at least 5 major news outlets


Our approach
Template design
Engaging content layout
Data integration
Format consistency
“The report strikes a balance between informative copy and eye-catching visuals… We can’t recommend The Graphic Design House highly enough and we’re looking forward to working with them again.”
Josh Kubale
Head of Communications
Earthwatch Europe


Results
-
Accessible Reporting: The final report clearly presented the findings of the Great UK WaterBlitz in a format that was readable and understandable for both public and specialist audiences.
-
Media Coverage: The report was featured on at least five major news outlets, including The Guardian, The Telegraph, and The Independent.
-
Stakeholder Engagement: Positive feedback from Earthwatch Europe highlighted the clarity and professional design of the report.
-
Wide Distribution: The report was shared digitally across Earthwatch’s platforms and by media partners, amplifying its reach and impact.
By delivering a report that communicated complex data in an accessible and visually clear way, we helped Earthwatch Europe showcase the importance of freshwater quality monitoring to a broad audience and reinforce public engagement with citizen science initiatives.
Ready to turn your data into a compelling story?
Our work in action
Hampshire & Isle of Wight Air Ambulance
We partner with Hampshire & Isle of Wight Air Ambulance to deliver clear, human-focused design that strengthens fundraising, outreach and education, helping them inspire life-saving action across every channel.
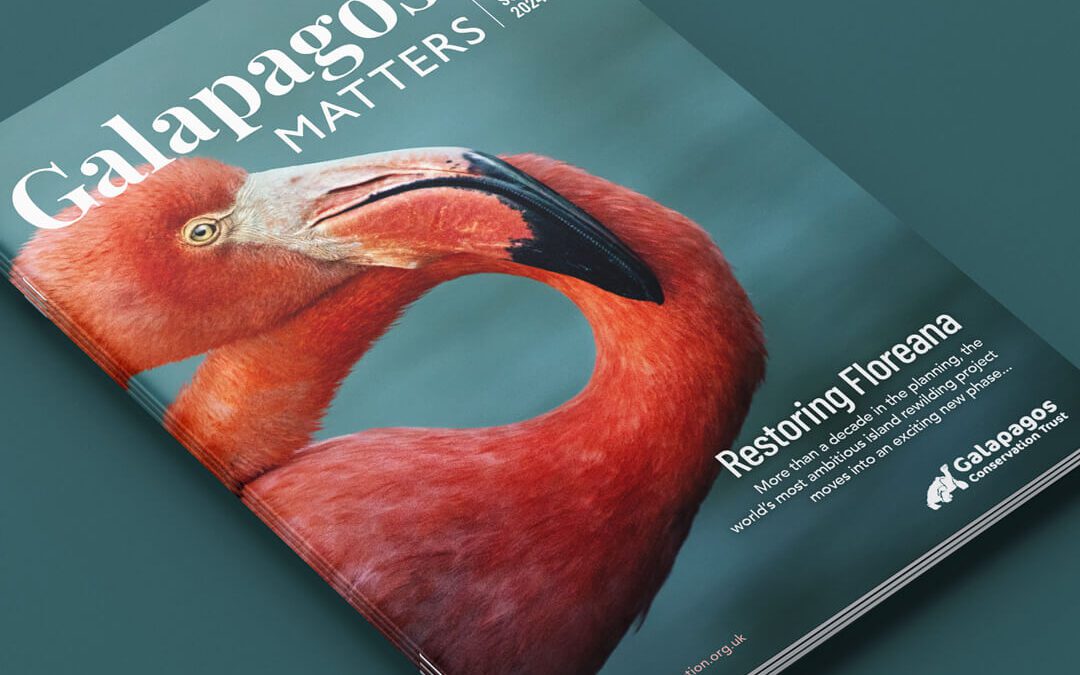
Galapagos Matters
We redesigned Galapagos Matters magazine for GCT, modernising layout, masthead, and imagery to boost engagement, and conservation impact.
Turning Complex Data into Clear, Compelling Design
From data-led reports to environmental campaigns that inspire action, we help organisations like Earthwatch turn complex information into stories that connect.
If you’re ready to bring clarity, creativity, and impact to your next publication, let’s collaborate to make it happen.