How to design an annual report that engages and inspires
Contents
Start with a clear visual direction
Use layout and white space to improve readability
Make data easier to understand with visual design
Design for digital and interactive experiences
Common annual report design mistakes to avoid
Create an annual report people want to read
Follow us
An annual report does much more than communicate performance. It reflects your organisation’s identity, showcases achievements and helps build trust with stakeholders. While the content matters, the way information is presented can significantly impact on how effectively it’s understood and remembered.
Your annual report design should balance readability, brand consistency and audience engagement. Whether you’re creating a printed publication, a digital annual report or an interactive experience, thoughtful design helps guide readers through complex information with ease. By combining strong visual storytelling with clear navigation and professional presentation, an annual report can become a valuable communication tool rather than simply a compliance document.
Start with a clear visual direction
Before designing an annual report, it’s important to establish a clear visual direction. This provides a guideline for every design decision and ensures the final publication feels cohesive.
Colours, typography, imagery and page layouts should align with existing brand guidelines wherever possible. These consistent visual elements help strengthen your brand recognition and create a professional impression that people can trust.
Many successful annual report design projects begin with moodboards or visual references. These help you explore different creative directions while ensuring the final design remains on brand for your organisation and its audience.
A strong visual foundation also makes it easier to maintain consistency throughout the publication, particularly when working across multiple sections, contributors or reporting periods. This further supports brand recognition and trust.
Use layout and white space to improve readability
Another key annual report design tip is to avoid overcrowding pages with excessive text and visual elements. Even the most valuable information can become difficult to absorb when presented in dense, cluttered layouts.
An effective, easy to follow layout uses grids, spacing and clear content hierarchy to guide readers naturally through each section. Strategic use of white space helps separate information, reduces visual fatigue and improves the overall readability of your report.
It’s also worth remembering that most readers scan reports rather than read every word. Clear headings, subheadings and visual cues make it easier to locate key information quickly.
Elements such as pull quotes, section dividers and highlighted statistics can help break up longer sections while maintaining visual balance. Combined with a well-structured typographic hierarchy, these features allow for a clear and engaging reading experience.

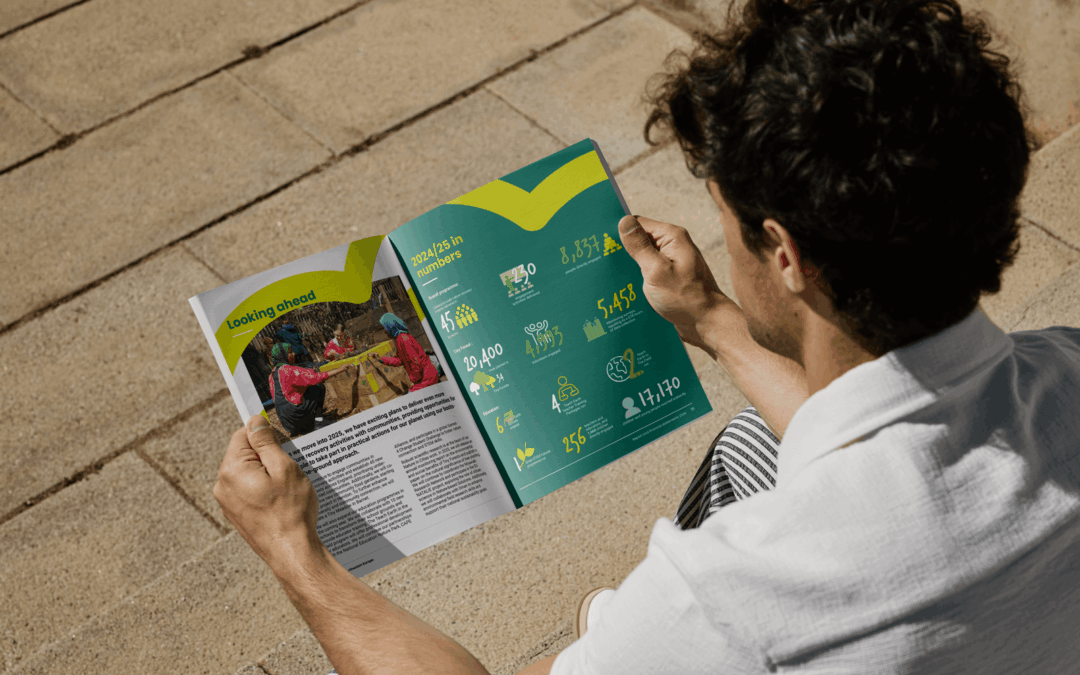
Make data easier to understand with visual design
Annual reports often contain large amounts of data, but presenting pages of figures and tables rarely keeps readers engaged. Effective data visualisation transforms complex information into clear, accessible insights.
Charts, graphs and infographics can help readers understand trends, performance and outcomes at a glance. Timelines can illustrate progress over time, while icons and visual markers can draw attention to important achievements or milestones.
Highlighting key performance indicators throughout the report can also improve understanding. Well-designed visual summaries allow stakeholders to absorb important information quickly without searching through detailed content.
When creating graphics, simplicity is essential. Clean charts with clear labels and logical layouts tend to be more effective than highly decorative designs. The goal should always be to support understanding rather than add unnecessary visual complexity.
By combining data visualisation with strong visual storytelling, you can create annual report designs that communicate information clearly and leave a lasting impression.
Design for digital and interactive experiences
As audiences increasingly consume information online, the traditional static PDF is no longer the only option. Many organisations are now investing in digital publishing approaches that provide a more engaging user experience.
A digital annual report can incorporate responsive layouts that adapt to different screen sizes, making content easier to access on mobile devices. This flexibility helps improve accessibility and user engagement.
You can deliver a more dynamic experience for readers with interactive report features such as:
- Clickable content menus
- Embedded videos
- Animated graphics
- Linked navigation
Interactive annual report features such as clickable contents menus, embedded videos, animated graphics and linked navigation can create a more dynamic experience for readers.
Applying UX design principles can make reports easier to explore and more enjoyable to read. Interactive elements also encourage audiences to spend more time engaging with content and key messages.
Common annual report design mistakes to avoid
Even strong content can be undermined by poor presentation. The most common annual report design mistakes include overcrowded layouts, inconsistent branding and weak visual hierarchy. Some examples of how these influence your report are:
- Using too many fonts, colours or design styles can create confusion and make reports feel unprofessional.
- Generic templates may also fail to reflect your identity or communicate your achievements effectively.
- Accessibility is another important consideration. Poor colour contrast, small text and unclear navigation can create barriers for readers.
A successful annual report design should prioritise clarity, consistency and ease of use throughout every section.
Create an annual report people want to read
Great annual reports combine thoughtful design with clear communication. When branding, readability and audience engagement work together, reports become more effective, memorable and valuable to stakeholders.
By focusing on strong layouts, visual storytelling, data visualisation and digital experiences, you can create reports that people genuinely want to explore.
At The Graphic Design House, we help our clients present complex information clearly through professional design, carefully structured layouts and high-quality print and digital delivery. With design, online proofing and in-house printing, we help bring annual reports together in a way that is both practical and engaging.
Looking to create a professionally designed annual report? Talk to us.
More insights
Impact report design that turns data into meaningful brand stories
Learn how impact report design transforms ESG data into clear, engaging brand stories by improving clarity, trust and stakeholder engagement.
Impact report vs annual report: what’s the difference?
Not sure whether you need an impact report or an annual report? Explore the differences, benefits and design considerations for both.

School prospectus design that reflects your identity
Strategic school prospectus design that builds trust, reflects your ethos and guides parents with clarity, structure and strong visual identity.